Pareto
Continuous distribution for modeling inequality.
Parameters
Location: Minimum value of the distribution.
Shape: Shape of the distribution.
Applications
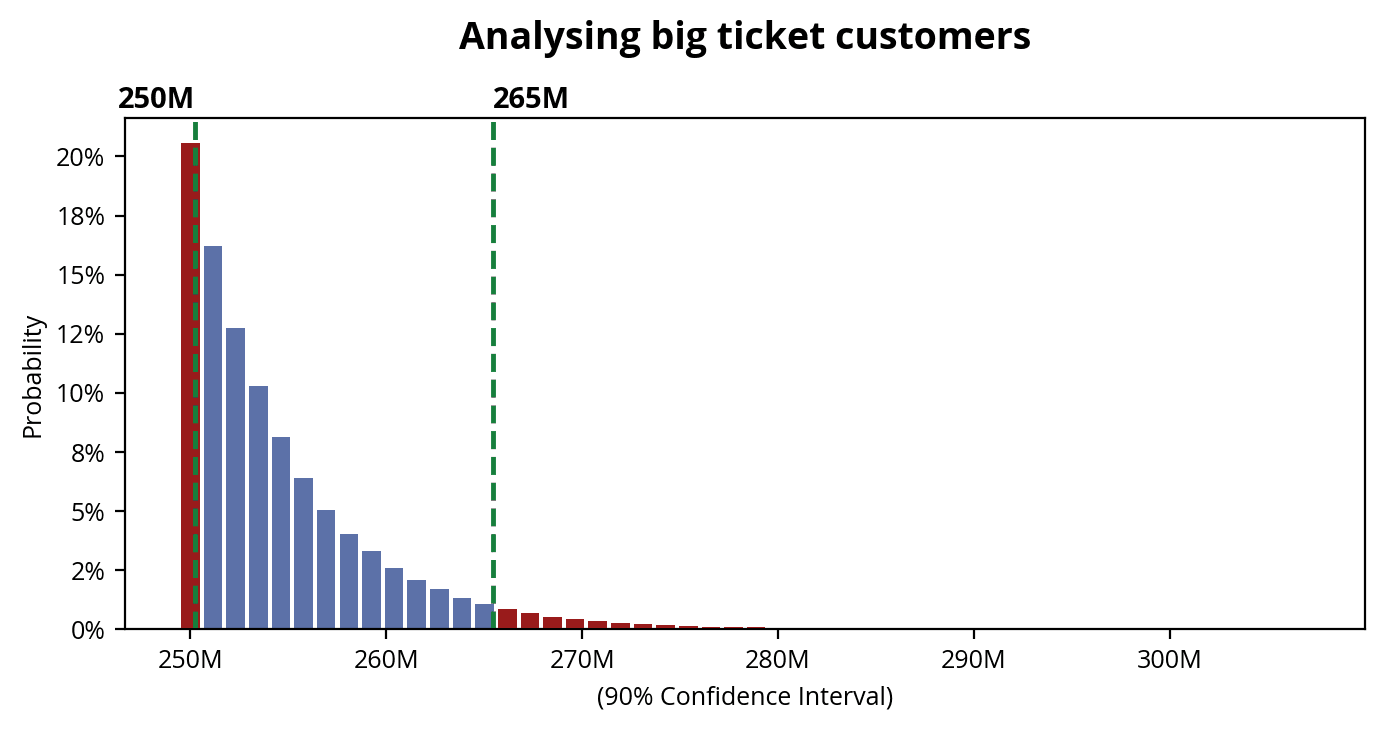
Applied in modeling customer or revenue concentration, where a few items drive most of the total, and the risk of very large losses or claims.
To apply Monte Carlo simulations to the inputs/outputs of your model, see the Scenarios - Monte Carlo module.
Outputs
Plot: Histogram of the distribution with selected Confidence Interval.
Data: Confidence Intervals, Summary Statistics and Percentiles. See a sample Monte Carlo output.
View demo for Normal distribution
Learn the basics in 5 minutes with our Quick Start Guide. To make the most of Fontics, check out our Tips & Tricks.