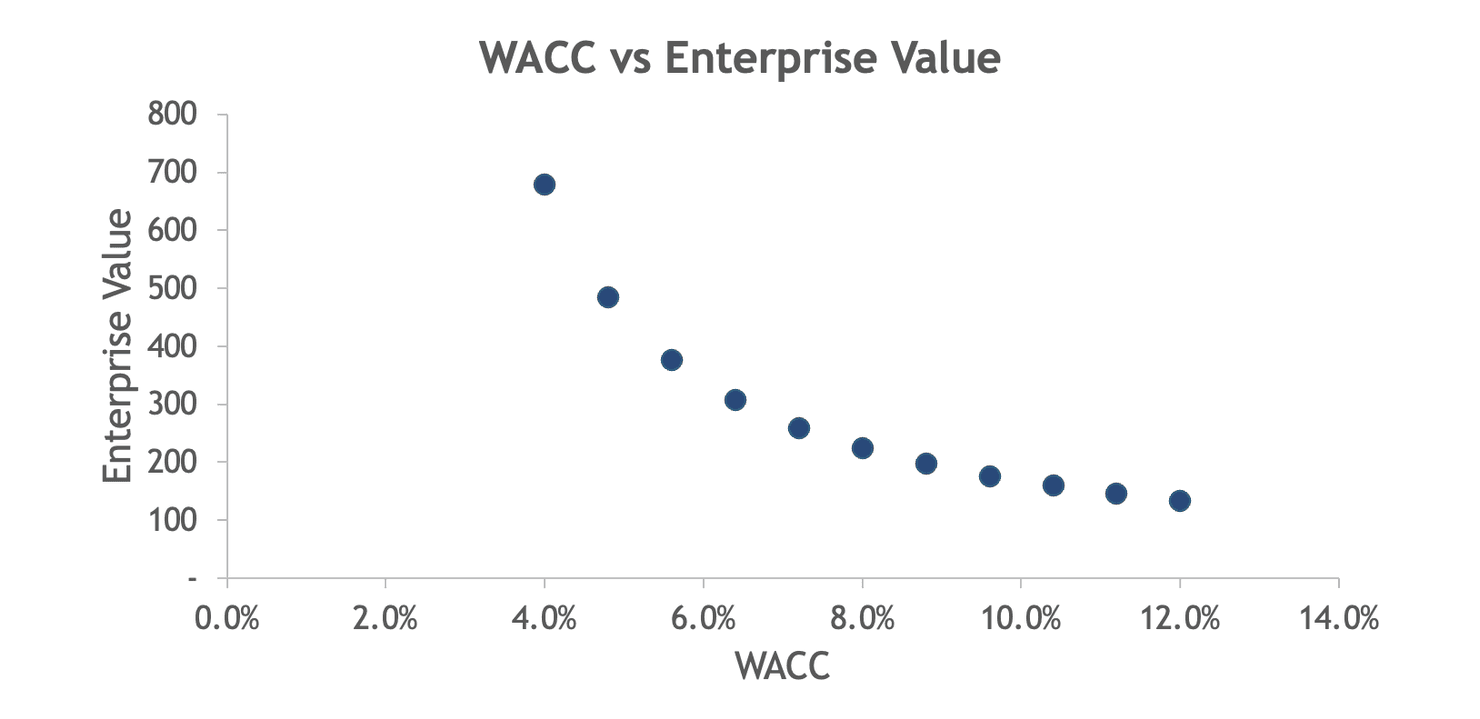
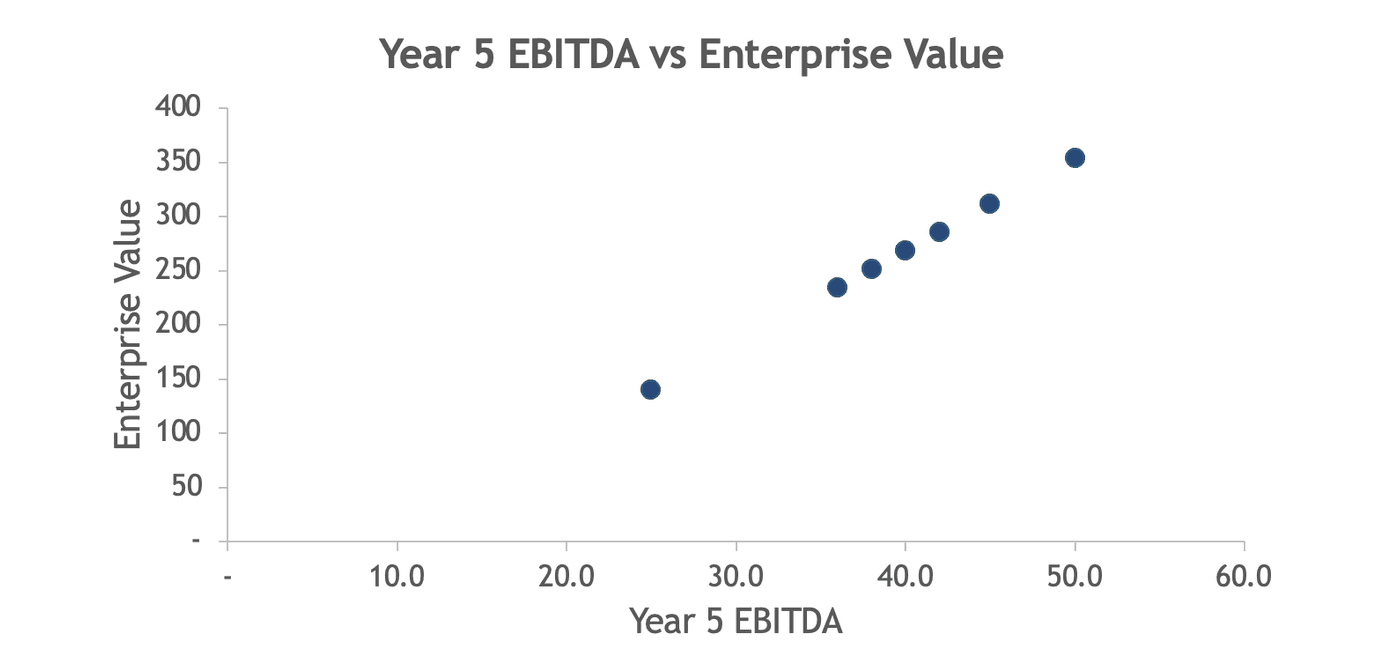
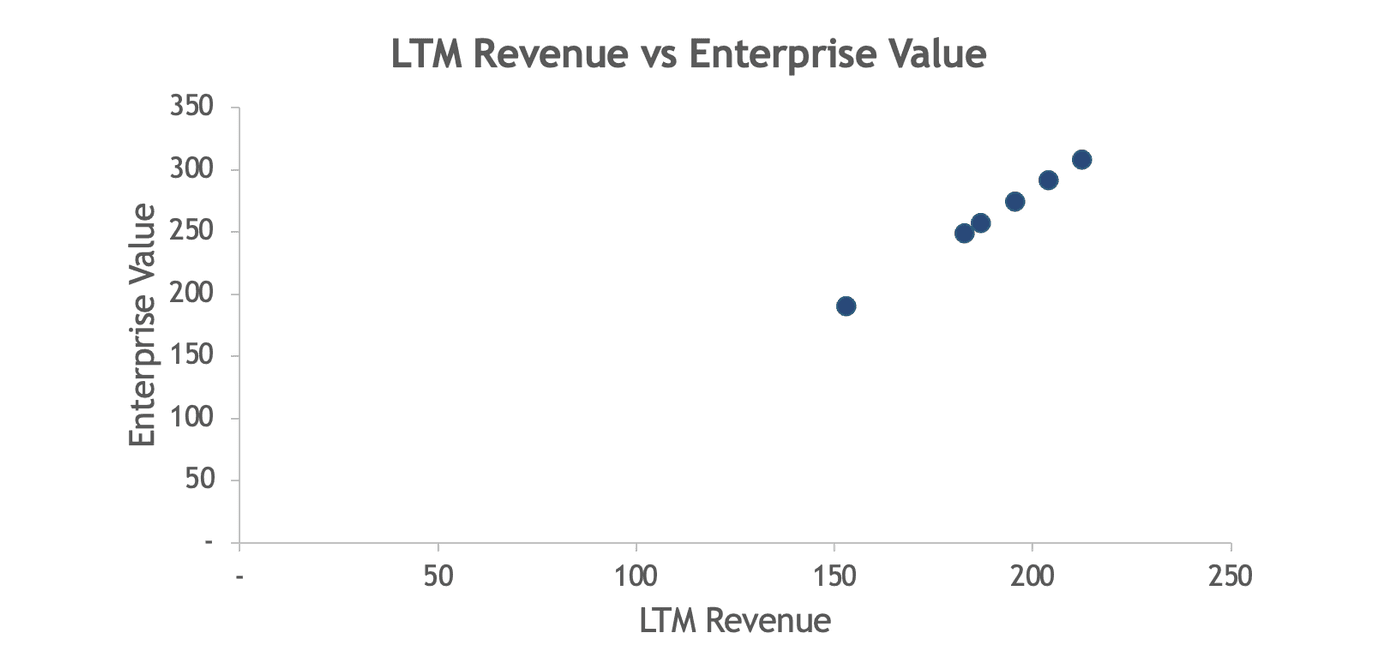
Flex one input at a time and see how the output moves.
Flex each input up or down and see its impact on the output.
Flex each input by your own percent changes (±10%, ±20%, ±50%).
Flex each input to your own values (12%, 250, 5,700).
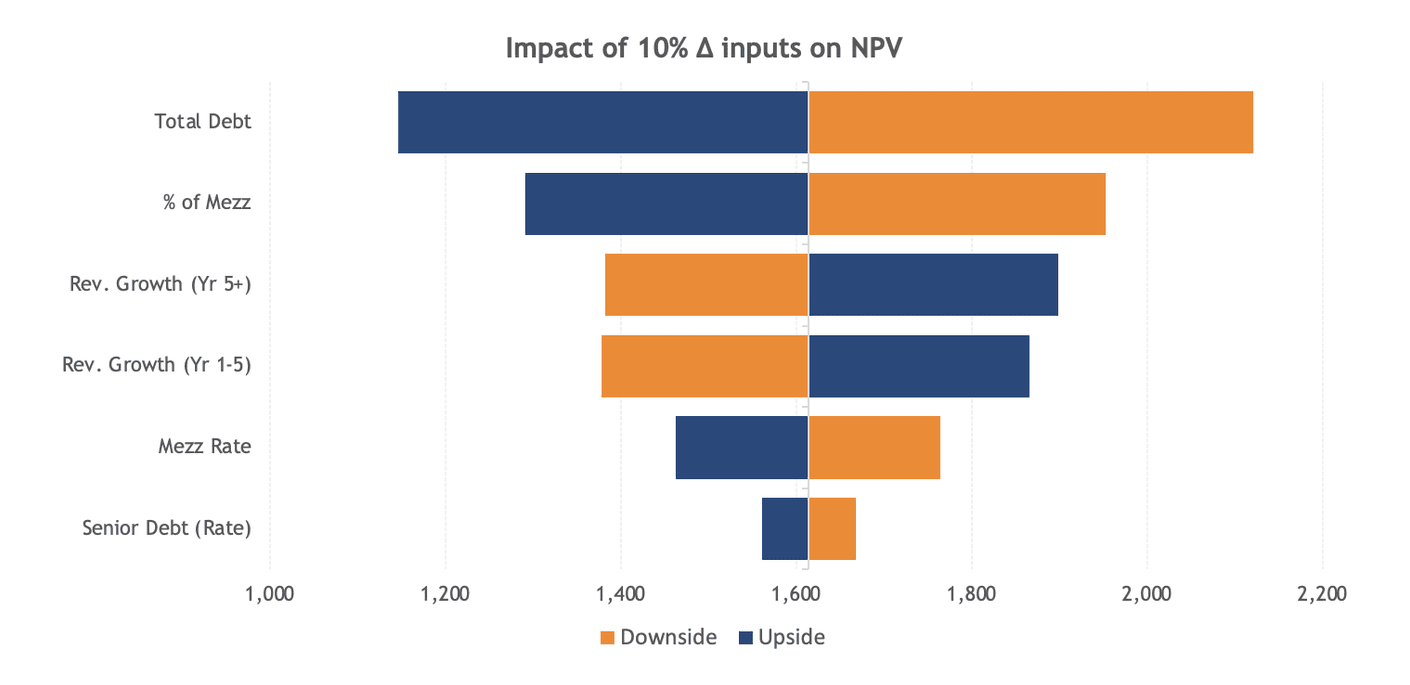
Rank the inputs that move your output most in an auto-sorted tornado chart.
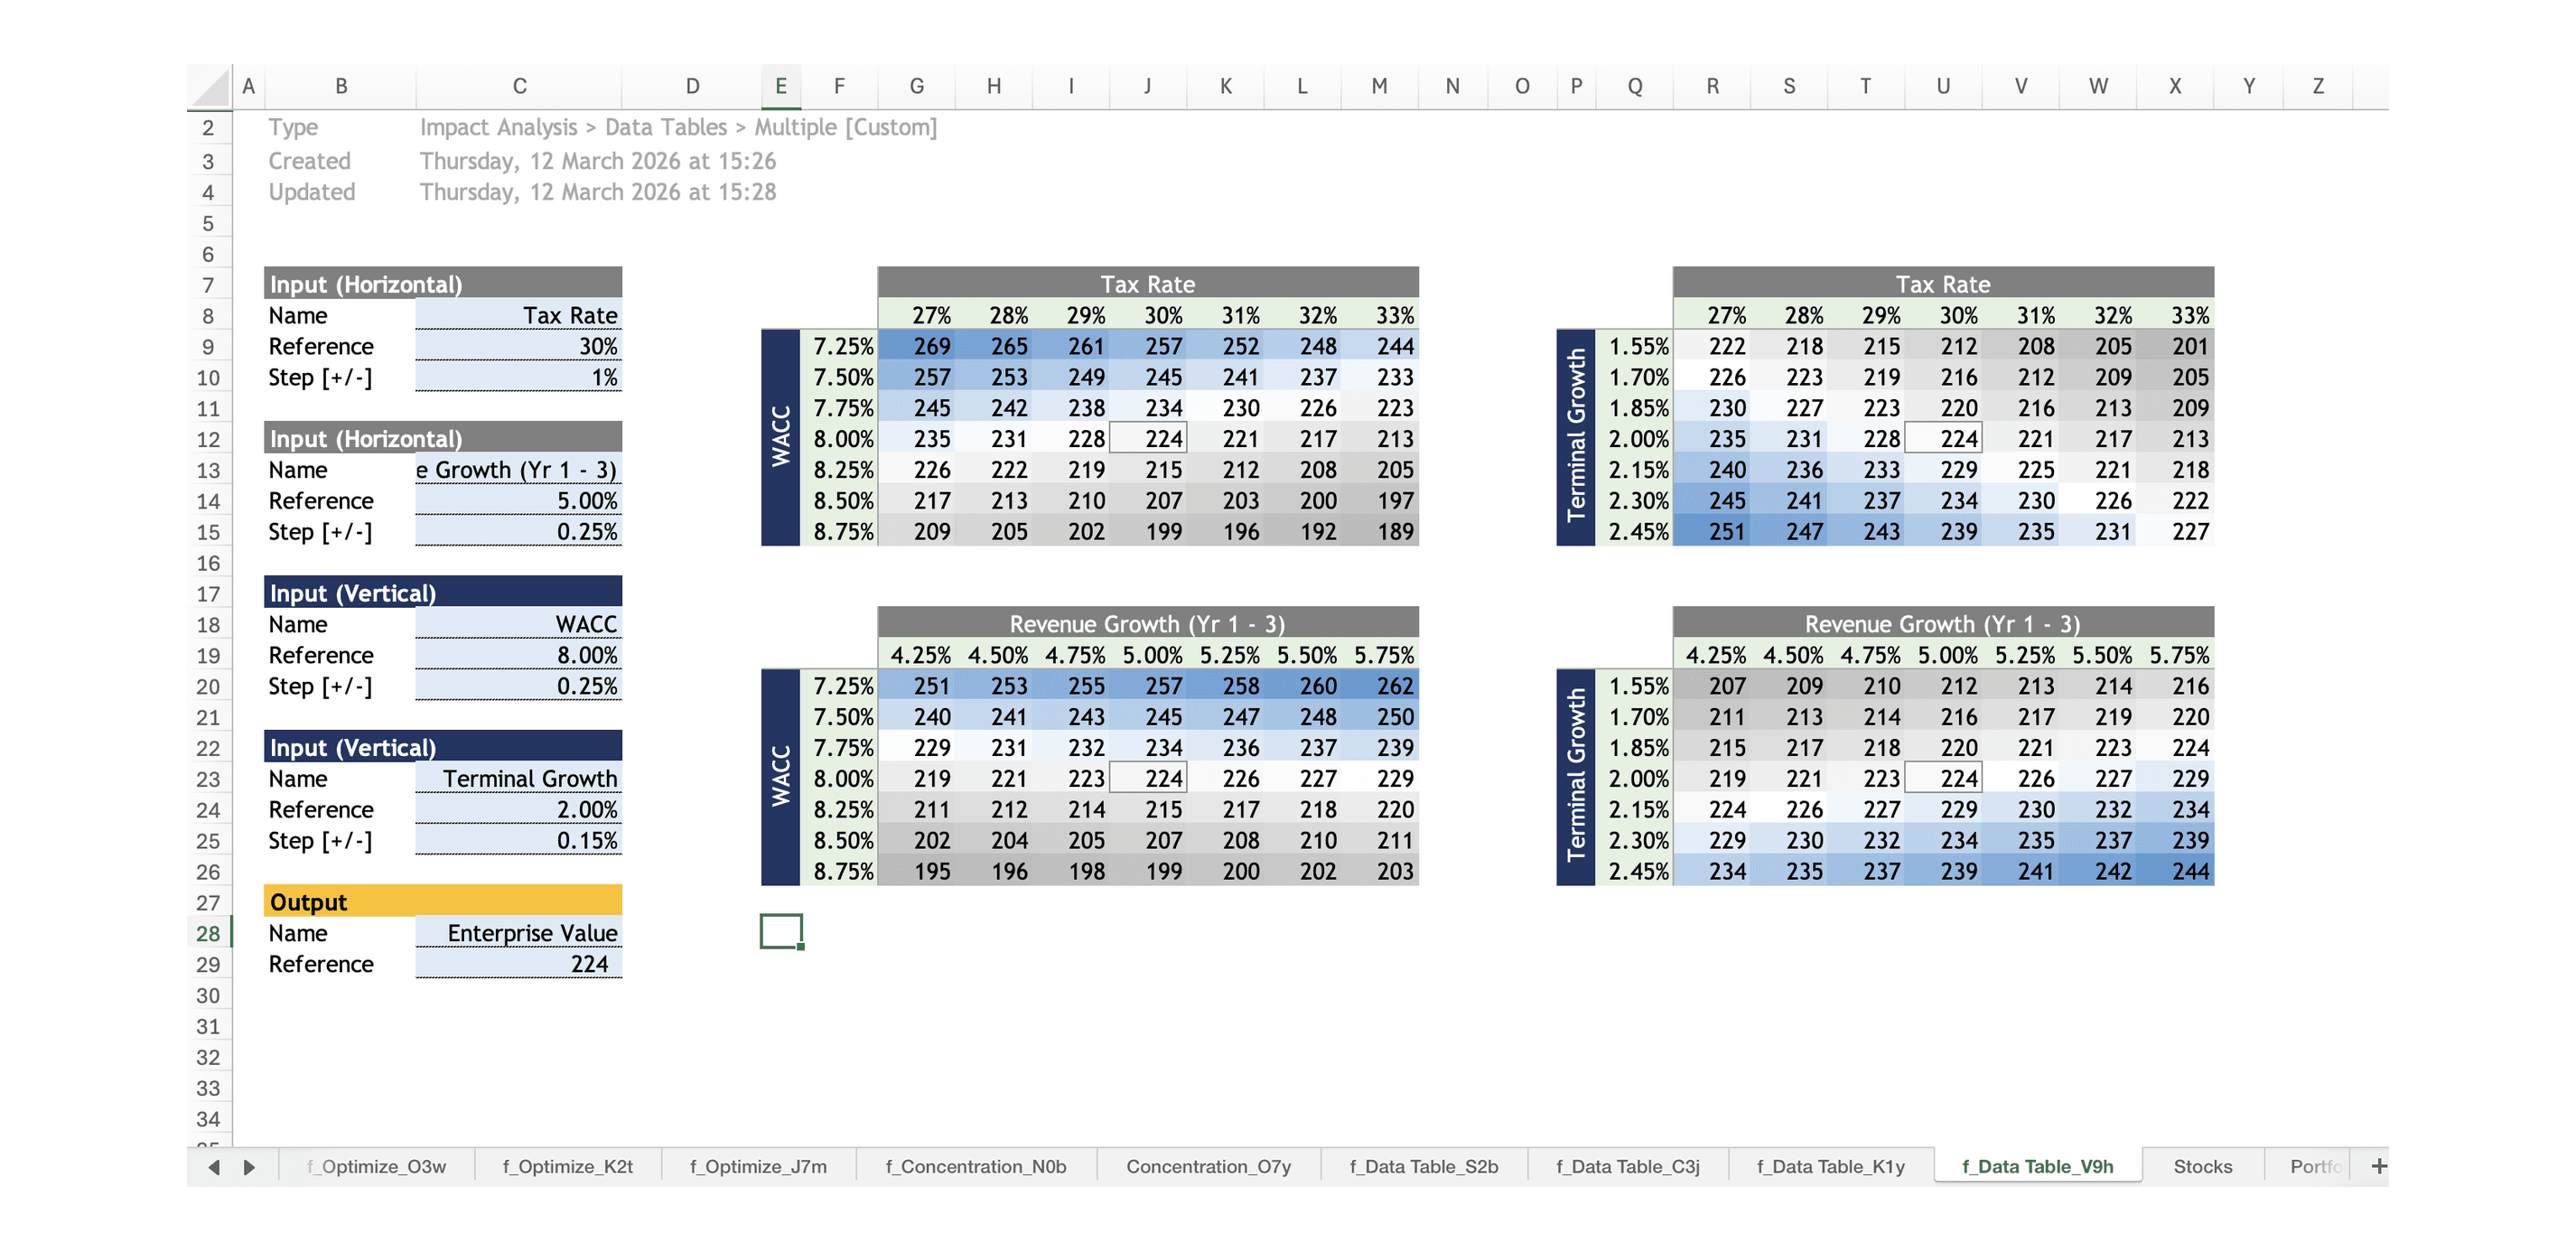
Build multiple data tables in seconds without slowing down Excel.