Compare valuation ranges and sense-check the financials.
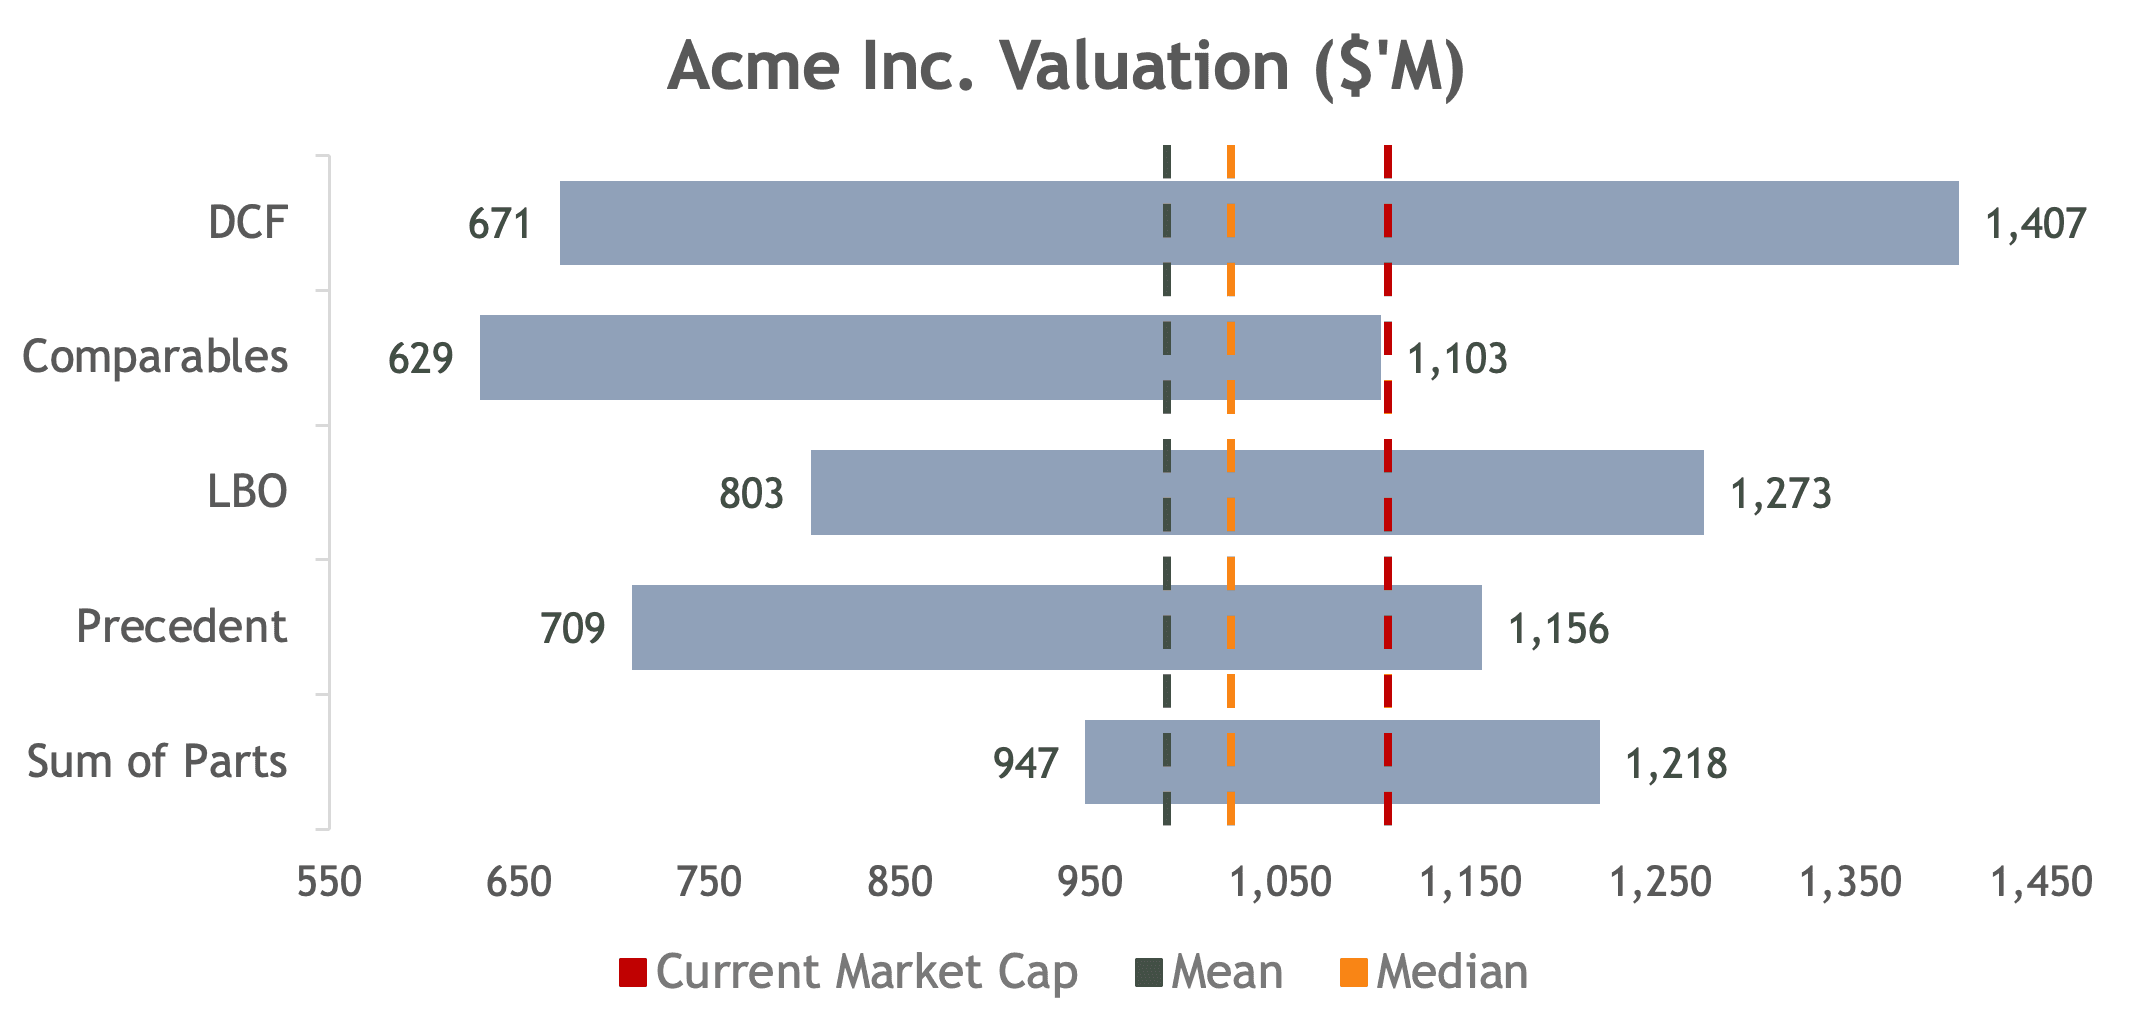
Compare valuation ranges from each method side by side.
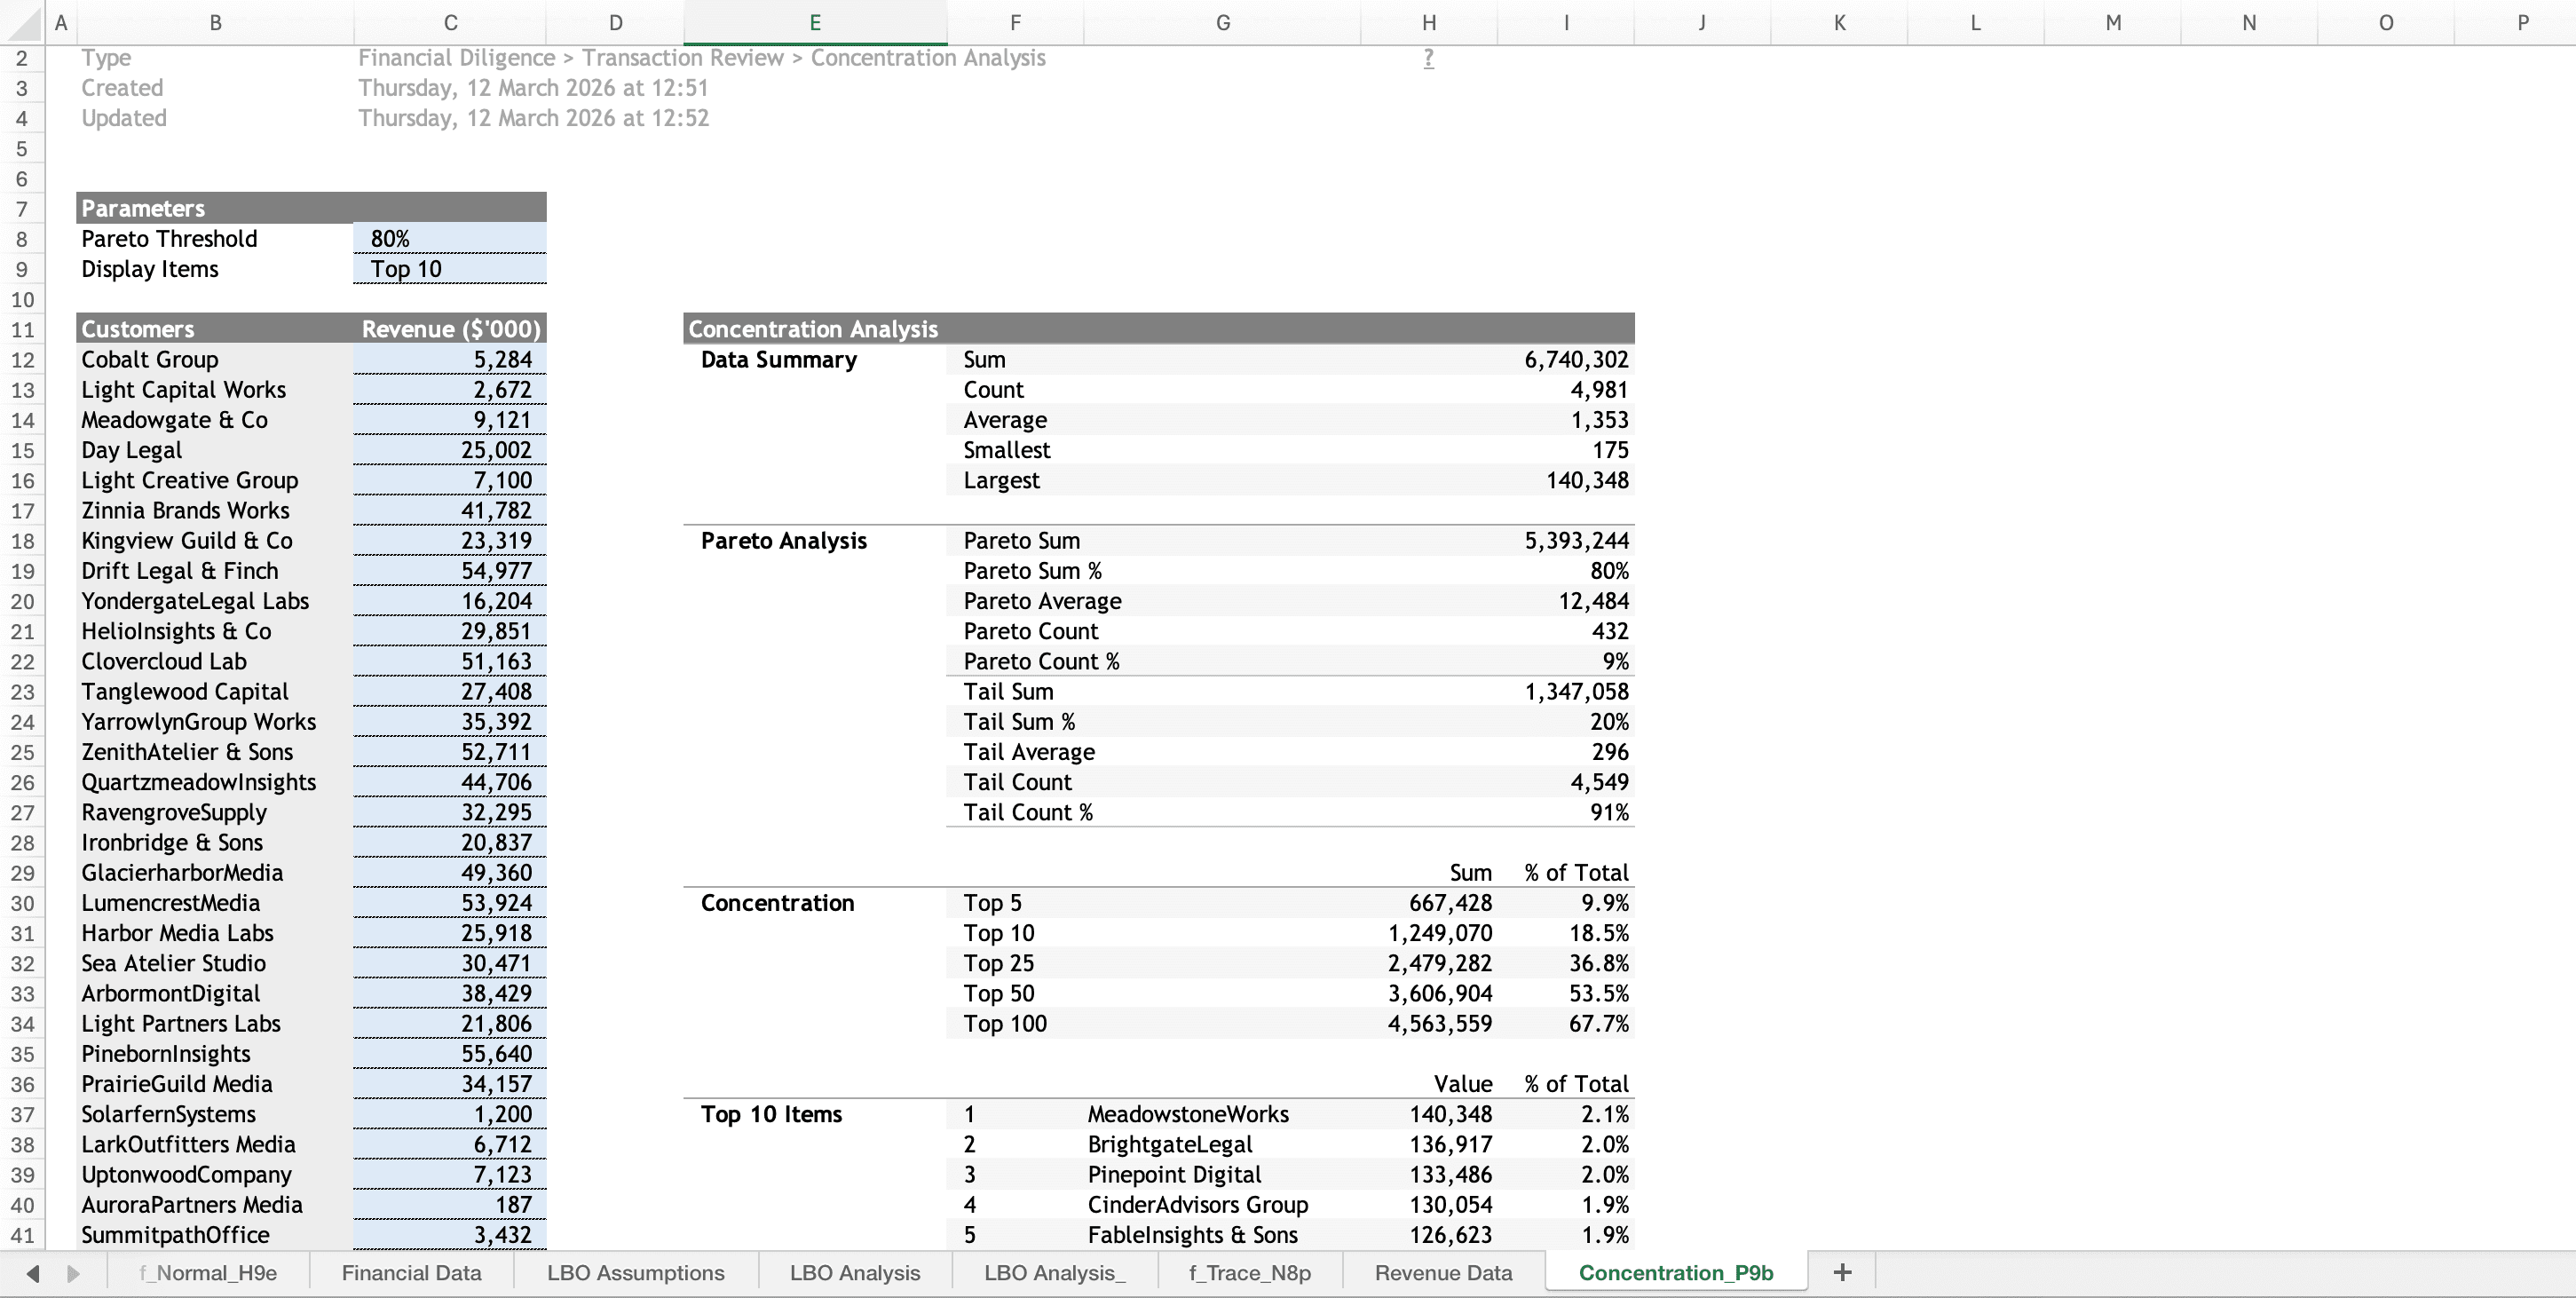
Find the top items in any series, such as customers, products or spend.
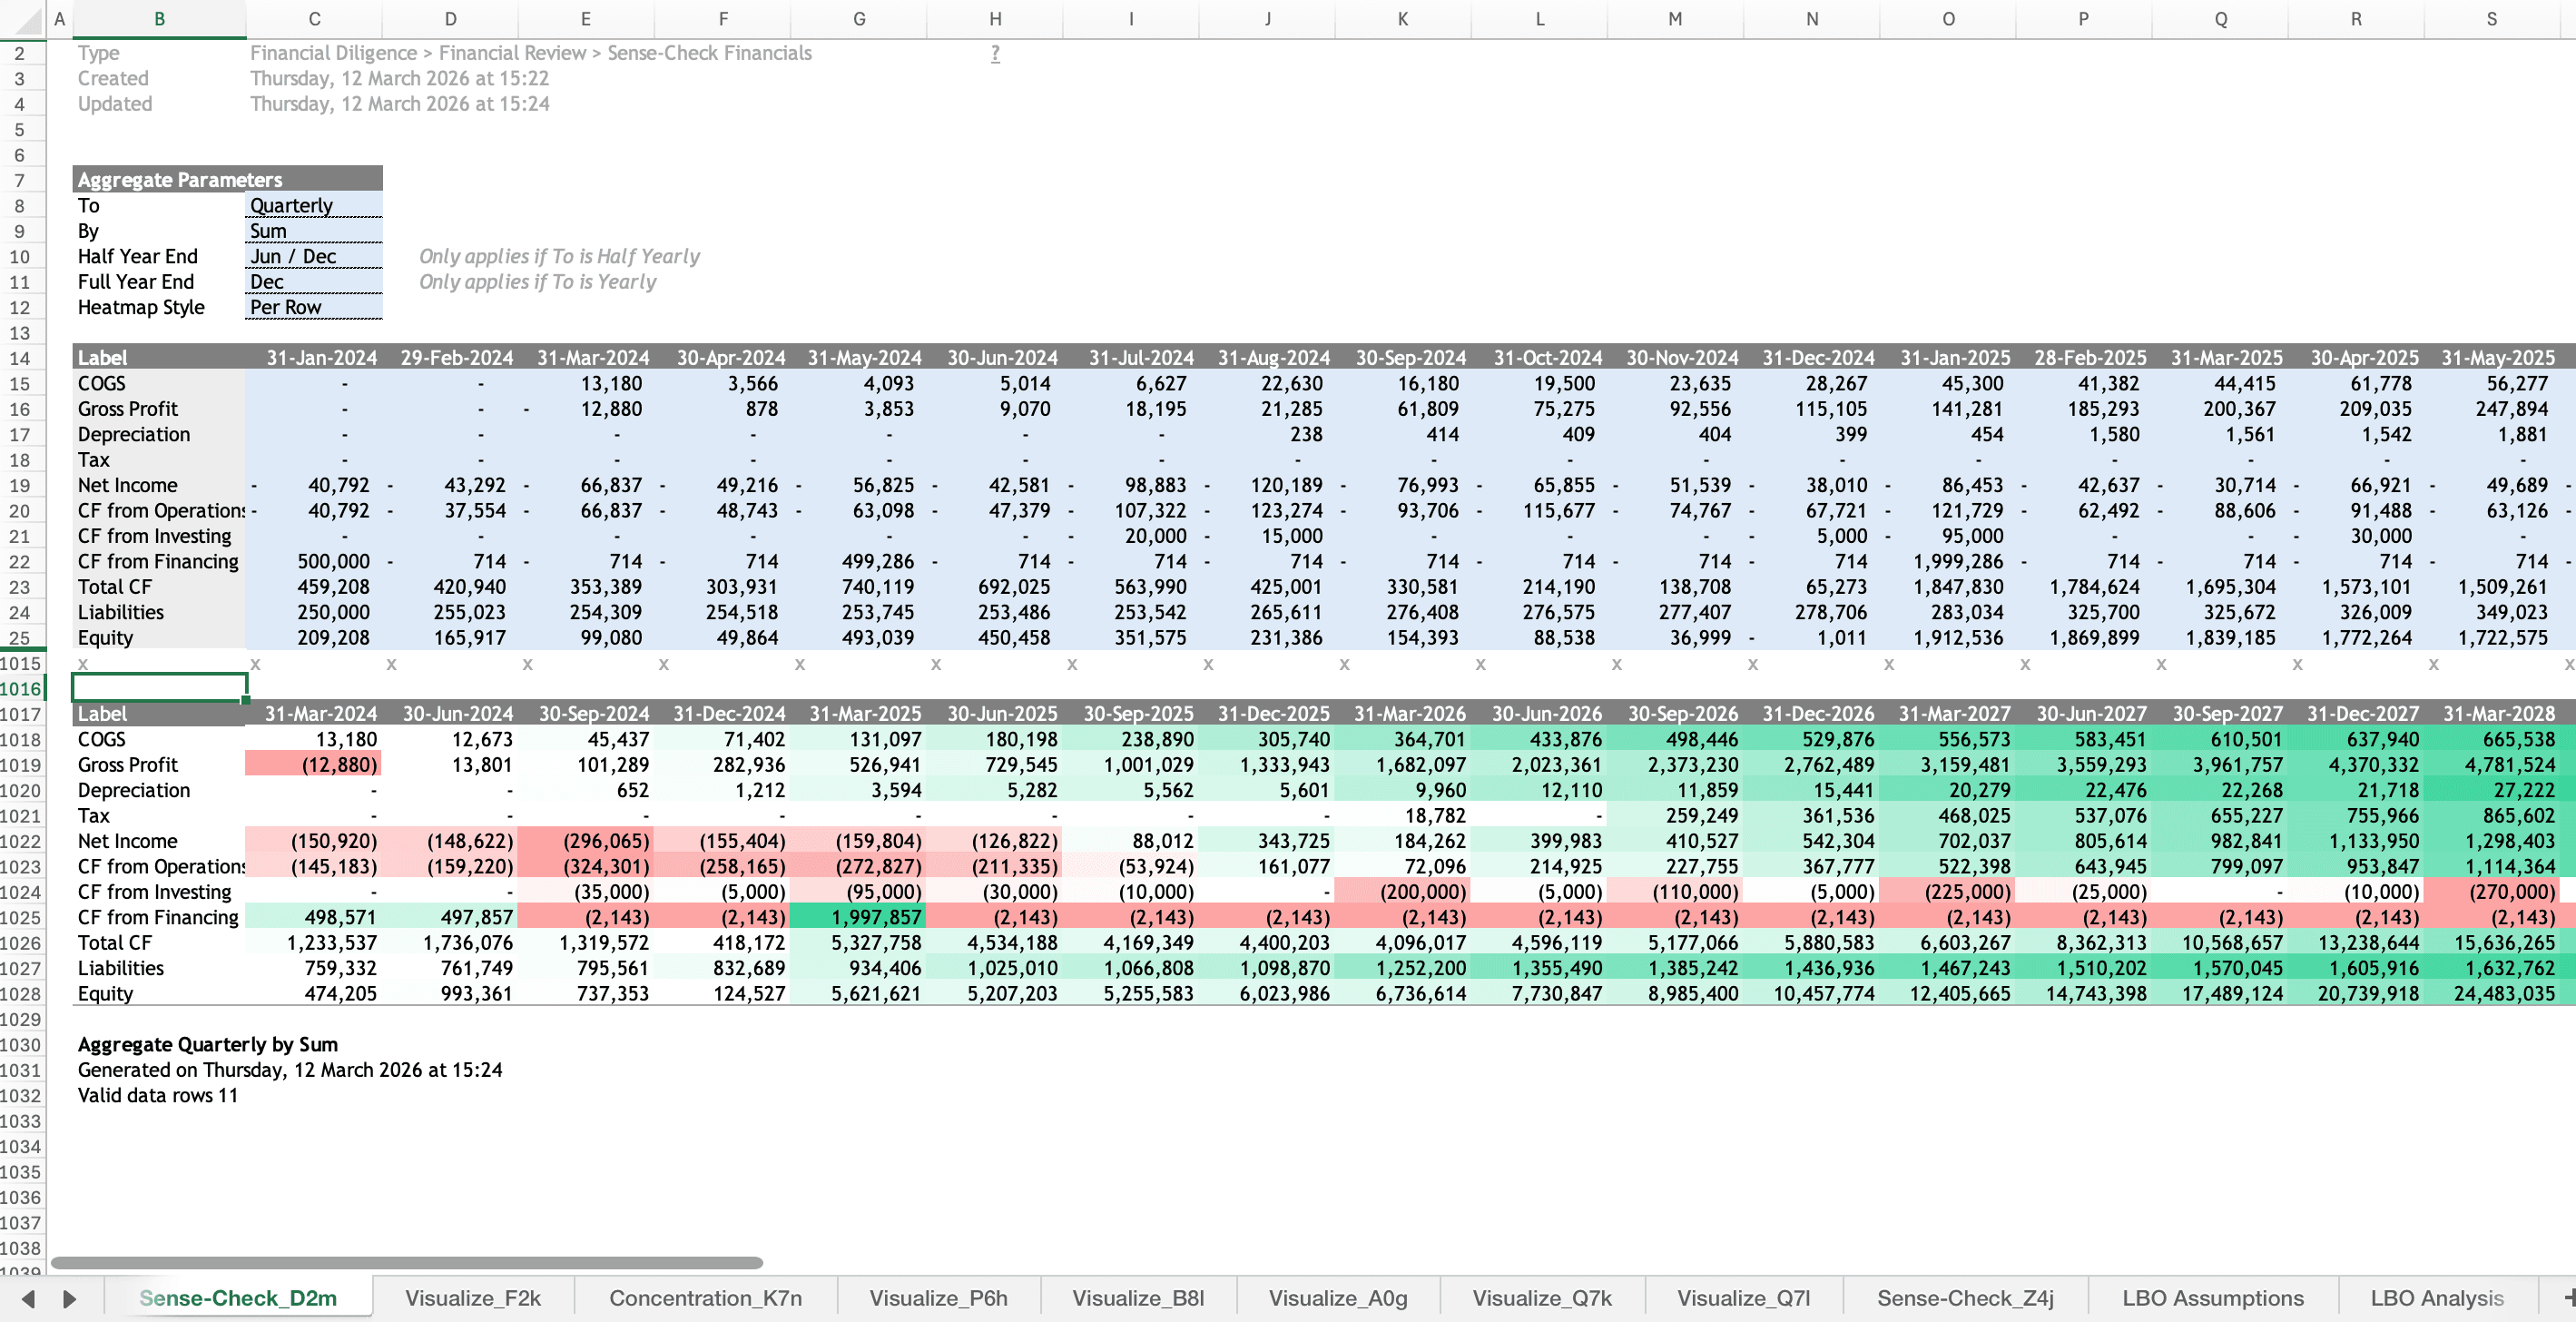
Roll up financials to quarter, half-year or year end and sense-check them with totals, ranges and a heat map.
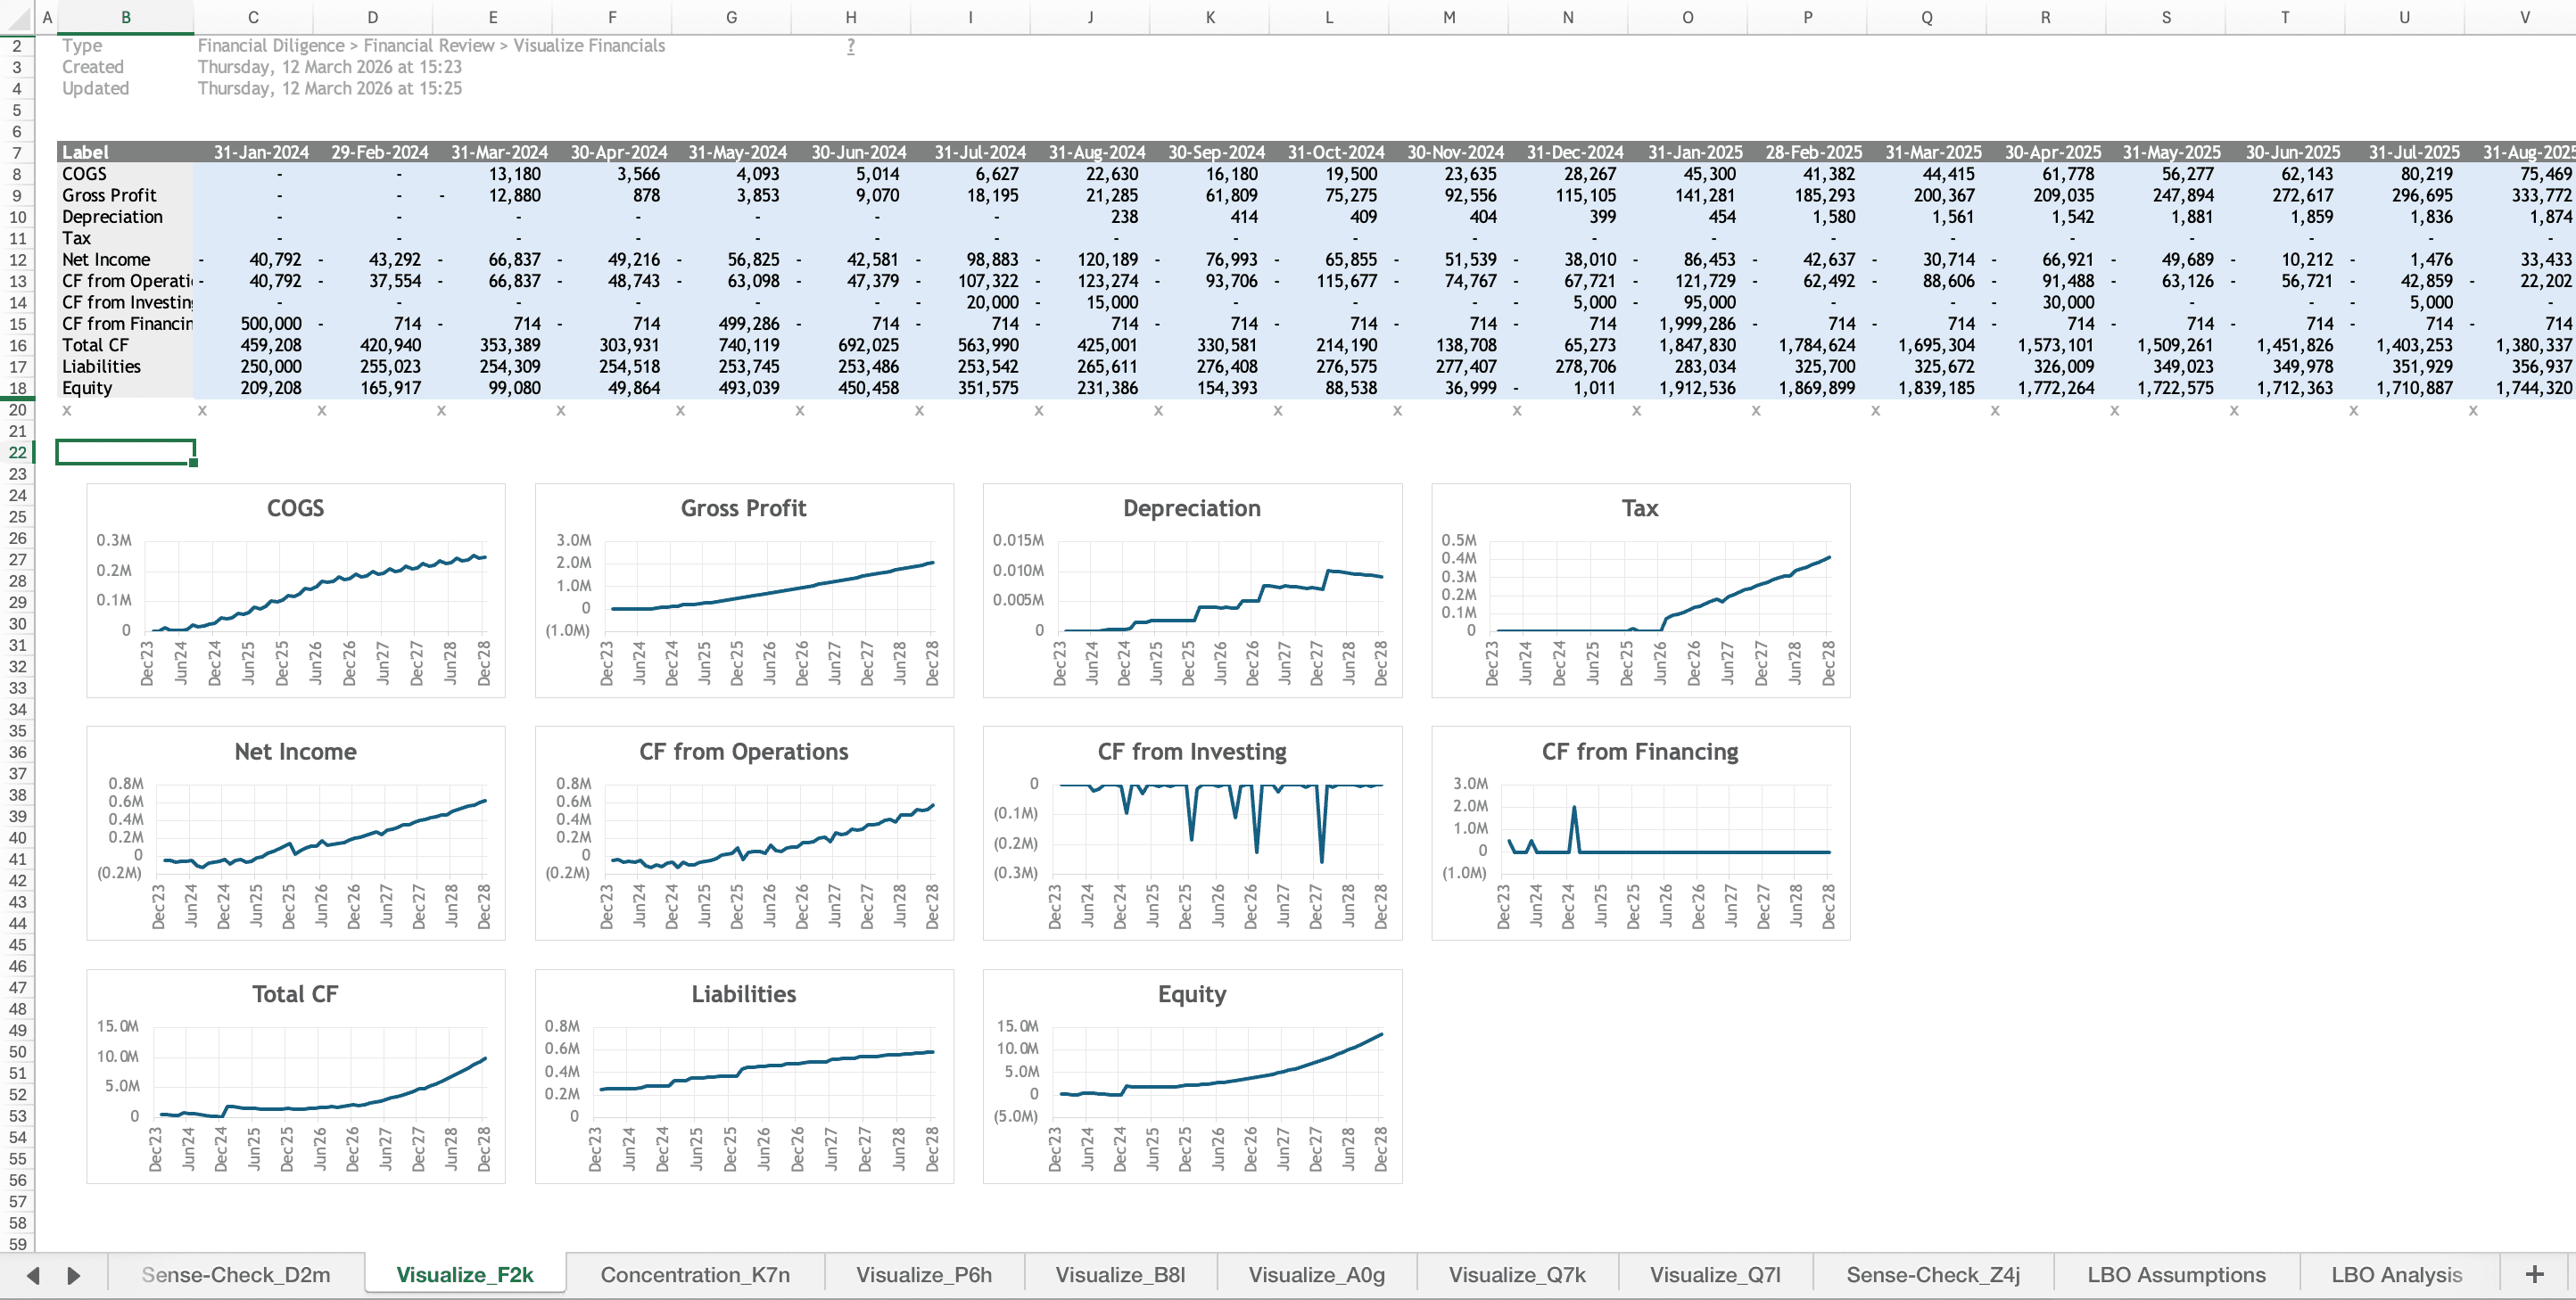
Chart key line items to spot trends, outliers and errors.